TheCognitive Processing Inventory (CPI)
Designed for:
Developed by
Scott L. Crouse, Ph.D
Copyright © 2007-2017 LDinfo Publishing
Jump to: Section 1 - Overview of the CPI Section 2 - Statistical Properties of the
CPI
Section 3 - The Processing Model of the
CPI
Section 4 - The CPI as Part of a Comprehensive LD Assessment Section 5 - Rating and Scoring the CPI Section 6 - Interpretation of the CPI Section 7 - Installation and Use of the CPI Professional Software
Section 1
Overview of the Cognitive Processing Inventory (CPI)
Development of the CPI: The CPI has been developed over the past thirty years to assist in the process of non-biased differential diagnosis of learning disabled students. It is based upon a thorough review of current neuropsychological research in addition to formal cognitive assessment of over 2000 students, hundreds of parent and student interviews, and direct behavioral observation of the learning disabled population. Ultimately, the intent was to develop a tool which could supplement standard assessment practices and also quantify the information which parents already have about their own child’s learning and cognitive skills. It has been found that the CPI can reliably differentiate specific subtypes of learning disabilities and promote clearer understanding of cognitive processing skills and appropriate educational intervention.
Standardization: The initial preliminary standardization of the CPI used a two-phase process completed over the course of one year. Phase one of that process involved distribution of CPI rating forms to over 5000 families in a suburban Minnesota area. Approximately 700 of these parent and student/self ratings were completed and returned for data analysis. Teachers were also asked to complete CPI ratings for students who had taken part in the home-rating process. After development of preliminary norms during phase one, phase two was initiated which involved posting an internet web-based CPI rating program. This on-line CPI rating allowed anyone with an internet connection to take part in the standardization process and facilitated the gathering of additional ratings from across the country. The web-based CPI has also enabled ongoing monitoring and revision of the norms. After establishment of preliminary norms through the two-phase process described above, several school districts and psychologists in private practice across the United States volunteered to complete a more traditional standardization process by gathering rating data from a broad random sampling of subjects. Norms are regularly updated though this process. Age and Gender: The current total standardization sample of 5776 cases was separated into six age/gender groups to be used in the development of the norms. Table 1.1 shows the total number of individuals in each group.
Table 1.1
Standardization Samples by Age and Gender
Age Group Male (N) Female (N)
4.0-6.9 438 444
7.0-10.9 569 547
11.0-14.9 489 583
15.0-18.9 405 546
19.0-22.9 443 471
23+ 417 424
Ethnicity: Ethnic distribution within the CPI standardization group has been adjusted to match current U.S. census data.
Because of concern regarding nonbiased assessment practices, further data analysis was conducted to determine the significance of any potential differences found between ratings of "white" and "non-white" individuals. Two-tailed t-tests were performed comparing white and non-white average raw scores obtained in each processing domain for parent, teacher, and student/self ratings. These statistical comparisons found no significant differences across any of the six processing domains or within the Global Processing Index as a function of ethnicity. This suggests that the CPI is able to provide a nonbiased assessment of cognitive processing skills.
Appropriate use of the CPI: The CPI is intended to provide an observable rating of a student's information processing and/or learning style. It primarily represents a convenient means of gathering information from parents about how they view their child's learning and thinking skills. And for older students (age 12 and up) and adults, valuable information can be directly obtained about how they view themselves. Although teacher norms are included, because the CPI is most accurate when completed by someone with long-term familiarity with the student, teacher ratings tend to be somewhat less reliable than parent ratings. For this reason it is suggested that the CPI only be used with teachers who are very familiar with the student in a variety of settings over a relatively long period of time. In general, parent ratings are preferred (as well as self-ratings for individuals over the age of 12).
The CPI is not intended to be used as a sole or even primary assessment of information processing. In general, it should be used in conjunction with objective assessment data and always interpreted with sound professional judgment.
Brief description of the rating scales: The information processing model chosen for the CPI includes the following six general areas of cognitive processing, each of which is based upon well-researched theories of learning and cognition:
Visual processing
Auditory processing
Sequential/rational processing
Conceptual/abstract processing
Processing speed
Executive Functioning
In order to evaluate these processing areas, rating forms are completed by parents, teachers, or the students themselves. These forms consist of 10 questions pertaining to background information followed by 50 rating items. Each item is rated on a scale of 1 to 5 with 1 indicating "obvious difficulty" and 5 indicating "obvious strength" for the person being rated. A rating of 3 is to be used either to indicate "average skill" or when the rater is uncertain about the correct response. This insures that "uncertain" ratings will not significantly skew the results.
Two versions of the rating forms are available in both English and Spanish; the CPI for children ages 4-7, and the CPI for ages 7-adult.
The CPI vs formal cognitive assessment: An individually-administered cognitive assessment instrument is primarily designed and intended to evaluate a student's general intellectual/cognitive abilities. Although subscale or subtest scatter analysis can be an effective means of developing hypotheses regarding an information processing "style", the utility of such approaches has not been clearly substantiated by research. This is probably due to the limited sample of behavior which is available within each subtest along with the inherent error of any "one time only" test of skill.
In contrast, a rating scale such as the CPI is intended to evaluate parents' (and teachers') long-term knowledge and understanding of how a specific child typically performs on everyday activities which have been observed over the course of several months or even years. Each item within the CPI has been carefully chosen because of its direct empirically-based relationship to the given processing area. As such, a certain level of reliability and validity is "built-into" the CPI rating process. Combining the CPI with formal cognitive assessment provides a very solid base of interpretive data for identifying an information processing pattern within a specific individual.
Section 2
Statistical Properties of the CPI
Scores Provided by the CPI:
Presently, the scores provided by the CPI are based upon a normative sample of over 5500 individuals ages 4 through 60, across the United States. Norms are provided for parent ratings, teacher ratings, and self ratings across all age groups. Standardized scores (provided through either hand or computer scoring) include:
• Standard Scores (SS) in each processing domain,
• A Global Processing Index (GPI), and
• Standard Deviation of Difference scores (SDD)
Standard Scores (SS) in each processing domain reflect how a particular student's rating compares to the population "norm" for that rating group (parent, teacher, or self). The mean is set at 100 and the standard deviation set at 15 in order to facilitate interpretation. These standard scores are provided on the Technical Report format of the CPI computer scoring program and can also be plotted on the Graphic Report format to provide a visual display of relative processing strengths and weaknesses.
The Global Processing Index (GPI) is also provided on the Technical Report format as a standard score (with a mean of 100 and standard deviation of 15) and simply represents the average "overall" rating of a particular subject. This is used to determine the relative significance of any differences found across the six processing domains. The GPI provides a standardized comparison between a specific person's rating and the "norms" of the standardization sample who have already been rated. Scores within + or - one standard deviation of the mean (from 85 to 115) represent the "average range" of the standardization group and account for approximately 67% of the total population scores. Although it is on the same scale as most IQ scores, the GPI should not be confused with a measure of general intelligence. The GPI is intended to provide a general measure of overall information processing skill (as viewed by those completing the ratings) which can then be used to determine relative processing strengths and weaknesses in specific areas (see below). Although a low GPI score may suggests rather significant overall information processing difficulty, it would not necessarily suggest low cognitive ability. This is a very important distinction.
The Standard Deviation of Difference (SDD) score is provided to assist with the interpretation of the significance of differences found between standard scores in each processing domain and the Global Processing Index. From a diagnostic standpoint, Standard Deviation of Difference (SDD) scores are considerably more valuable than the GPI because these SDD scores reflect measurable differences within the individual rather than in comparison to other students.
SDD scores provide a measure of the significance of differences found between an individual's GPI and their particular rating in each specific processing area. As with the GPI, the SDD scores relate to the differences found within the standardization group of the "normal population". SDD scores within the -1 to +1 range represent the average or "normal" differences found within 67% of the general population. Based upon the norms, approximately 16% of the general population would obtain an SDD score in any given area lower than -1 and 16% of the general population would be expected to have SDD scores above +1. Only 2% of the general population would be expected to have SDD scores either less than -2 or greater than +2. From a diagnostic perspective, a processing SDD score below -1 could be considered significant enough to negatively impact learning.
For interpretation, "moderate discrepancy" is found in the range of 1 to 2 SDDs (either positive or negative) from the GPI. 2 or more SDDs from the GPI represents a "severe discrepancy" and would indicate either a significant strength or significant weakness in that processing area. Besides the SDD scores in each processing area, the CPI also provides SDD scores reflective of differences between dichotomously paired processing domains. These would included: Auditory Processing vs Visual Processing, and Sequential Processing vs Conceptual processing. Again, 1 or more SDDs between these processing areas would indicate a moderate to significant difference.
SDDs from GPI Interpretation
2 + Significant Relative Strength
1 to 2 Moderate Relative Strength
-1 to +1 Average Range
-1 to -2 Moderate Relative Weakness
-2 + Significant Relative Weakness
The computer-generated report automatically calculates the number of SDDs that a specific processing standard score falls above or below the Global Processing Index. For example, if the GPI is 100 and the Auditory Processing SS is 88, that may translate to a difference of -1.5 SDDs. This would suggest that Auditory Processing is moderately discrepant from the GPI indicating an apparent relative weakness in this area. The actual SDD values found within the various norm groups are listed in the norms tables in Appendix E.
Intra-cognitive vs inter-cognitive interpretation:
Beginning with version 5.0 of the CPI scoring software, examiners are provided the option of either utilizing the default “intra-cognitive” interpretation (evaluating the significance of differences within the individual subject) or switching to a somewhat more traditional “inter-cognitive” interpretation (evaluating the significance of differences between the individual subject and the mean of the norm group). Before deciding which interpretation to use it is very important to fully understand the design and intent of the CPI as well as the pros and cons of each option.
Intra-cognitive comparison represents the true design and intent of the CPI and also follows the philosophical underpinnings of the term “Learning Disability”. In essence, a true learning disability exists when a student’s underachievement is caused by information processing differences within his or her brain. By default, the CPI provides a formal evaluation of intra-cognitive processing differences by comparing the differences noted on the CPI rating forms with “normal” differences found within the norm group. To do this, the CPI scoring program first calculates the subject’s global processing index (GPI) for each rating as well as standard scores in each processing area. These standard scores are then converted to standard deviation of difference (SDD) scores based upon the variance of scores among the norm group. These SDD scores range from -4 to +4 with a mean of 0 (zero). A score of zero simply means that the specific processing area score exactly matches the GPI of that particular rating. Since each specific rating for a particular subject is converted to this scale, all ratings can be directly plotted for visual comparison of relative strengths and/or weaknesses. In other words, even if one rating was rather critical and another rating somewhat lenient, intra-cognitive interpretation gives all ratings a mean of zero so that relative highs and lows can be directly compared.
In conrast, Inter-cognitive comparison represents a means of more directly comparing a given subject’s processing skills with the mean of the norm group. In other words, this interpretation simply compares a given subject’s standard scores in each processing area with the statistical mean of the norm group (100). Standard scores between 70 and 85 are considered to be of “moderate concern” while scores below 70 would be considered “severe concern”. Although this is a traditional interpretive approach (typically used with other types of assessment instruments) it does not provide a means of comparing the significance of differences within the individual subject. The option of inter-cognitive interpretation is offered primarily for situations in which a subject may have generalized information processing issues (across categories) which may not be revealed via intra-cognitive comparison.
Reliability of the CPI:
Test-Retest Stability - An evaluation of test-retest reliability was performed which compared initial and follow-up parent CPI ratings of 150 students at approximate one-year intervals. Of the 150 follow-up sets of ratings, 92% were found to show a pattern of processing which identified identical areas of relatively significant strength and weakness as were noted on the initial rating. This suggests an overall stability correlation of approximately .92.
Internal Consistency - In order to assess the internal consistency and overall reliability of the CPI a split-half method was employed in which the entire CPI item pool and each subscale was randomly divided into 2 similar forms. These split-half correlations were then gathered from the initial normative sample of 4554 cases and are presented in Table 2.1. Correlations across specific processing areas range from .85 to .92 with overall Global Processing Index (GPI) correlations ranging from .94 to .96. This data verifies that the CPI has very strong internal consistency. Table 2.1 Split-Half Reliability Coefficients
Parent Teacher Self Auditory .88 .91 .87 Visual .85 .90 .85 Sequential .87 .89 .89 Conceptual .89 .92 .86 Processing Speed .88 .88 .90 Executive Functioning .89 .92 .89 Global Processing Index .95 .96 .94
Validity of the CPI:
Content Validity - The initial item selection and categorization for the CPI was derived through an empirically-based process which utilized published research findings related to cognitive processing along with hundreds of direct observations and interviews with parents and teachers of learning disabled students. The initial item groupings were then refined through an extensive process of factor analysis to ensure that each item was indeed loading on the specific "processing" factor being rated.
Predictive Validity - In order to evaluate predictive validity of the CPI, parent ratings were obtained on 150 students in grades 3 through 12 who were concurrently being formally evaluated for possible special education services. Using only a pattern analysis* of the general processing clusters of the CPI, correct predictions of learning disability placement were made for 118 of the 150 students (78%) with 12% false-positive and 10% false-negative predictions.
Concurrent Validity - Using data collected during the normative process, concurrent validity was evaluated through parent, student/self, and teacher CPI ratings of students in grades 3 through 12 who had previously been formally identified as having some form of learning disability. For parent ratings of LD students, 86 out of 102 (84%) were found to demonstrate a significant information processing weakness on the CPI at the .15 level. For student/self ratings of LD students, 39 out of 55 (71%) were found to demonstrate a significant information processing weakness on the CPI at the .15 level. For teacher ratings of LD students, 67 out of 86 (78%) were found to demonstrate a significant information processing weakness on the CPI at the .15 level.
Table 2.4 Concurrent Validity Identified LD Students
Ratings Total Significant Correlation Parent 102 86 .84 Student/self (LD) 55 39 .71 Teacher 86 67 .78
Overall, these reliability and validity studies provide very strong support for both the CPI as a screening/assessment instrument and the underlying information processing model chosen.
Section 3
The Processing Model of the CPI
There are many differing and often conflicting theories of cognitive development and information processing. The information processing model chosen for the CPI includes the following six general areas of cognitive processing, each of which is based upon well-researched theories of learning and cognition:
Visual processing
Auditory processing
Sequential/rational processing
Conceptual/holistic processing
Processing speed
Executive Functioning
These broad processing areas have been chosen because of strong historical and empirical support along with the direct educational implications each can provide.
The auditory/visual (sometimes referred to as verbal/non-verbal or linguistic/visuospatial) comparison is the oldest and most extensively researched processing dichotomy. These were the original processing areas described when the concept of a learning disability was first introduced. Various intelligence scales such as Wechsler scales, McCarthy, DAS, Stanford Binet, etc. have continued to emphasize these as primary processing areas. Research has consistently supported the assumption that the brain processes auditory and visual information in very different ways, and when a student demonstrates a significant preference for one over the other, a learning disability can occur.
The sequential/conceptual (sometimes referred to as sequential/simultaneous or successive/holistic) comparison has evolved directly from extensive neuropsychological research conducted over the past several decades. The implications from this research have clearly suggested that each of the two cerebral hemispheres processes information in a rather unique fashion. The left hemisphere appears to process information in a very orderly and detailed manner whereas the right hemisphere takes a more general, holistic processing approach. The Kauffman Assessment Battery for Children (K-ABC) was developed directly from this neuropsychological research base. Although the term "rational thinking" has taken on a somewhat different meaning, taken literally, the word "rational" means "part by part" which is virtually synonymous with our understanding of left-brain processing. However, since the term "sequential processing" is more widely associated with learning disabilities it will be primarily used to describe this processing domain within the CPI.
Processing speed is one of the most recently identified cognitive processing areas, well-supported in research and literature. The actual speed of neural transmission has been measured and found to correlate negatively with some forms of learning difficulties (e.g. low processign speed = high probability of learning difficulty). This has been endorsed as a distinct area of information processing within the latest editions of the WISC, Woodcock-Johnson, and various other cognitive assessment batteries.
The area of Executive Functioning has been added to version 5.0 of the CPI due to the increasing popularity of this cognitive construct within the educational and mental health communities. Executive Functioning refers to the overall ability to manage or regulate all of the various cognitive and emotional processes. This involves initiation, planning, organization, and execution of various tasks as well as the ability to cope with transitions or regulate emotional responses. Subjects with Executive Functioning issues often need externalized structure (i.e. lists, schedules, etc.) and typically respond well to increased structure and predictability in their lives. Weakness in this area is often associated with an attention deficit disorder.
Educational Implications: The intent of any information processing model is to explain the reasons for the educational difficulties experienced by students. The processing model used with the CPI not only helps to explain existing problems but also provides specific guidance for intervention along with the potential to predict other possible areas of difficulty (both educational and non-educational) which typically relate to a particular information processing style. A text is also available entitled "Uncovering the Mysteries of your Learning Disability: Discovery, Self-awareness, Self-advocacy" which is based upon the processing model used within the CPI and is intended to help students understand and cope with their specific learning disabilities. This text provides direct and specific home and classroom interventions for each of the 6 processing subtypes covered by the CPI.
Clarification of the 6 general processing domains:
Visual Processing involves the ability to understand, remember and utilize visual information even when it becomes abstract or complex. When they see something, especially something complex, do they understand it quickly and easily. Can they “visualize” things (like pictures, shapes, words, etc.) in their head? Can they remember information that they see?
Visual Processing involves:
seeing differences between things remembering visual details filling in missing parts in pictures remembering general characteristics visual-motor coordination visualization and imagination organization of their room, desk, etc. artistic skills
Students with a general visual processing disability often experience most learning difficulty in the areas of math and spelling because they have trouble “visualizing” words, letters, symbols, etc.
Specific difficulties may include:
- writing poor handwriting poor spelling (cannot visualize the words) - math difficulty visualizing problems difficulty with cluttered worksheets - reading slow speed poor comprehension - general poor organization/planning/neatness difficulty rechecking work for accuracy difficulty learning by demonstration difficulty learning by video
Auditory Processing involves the general ability to understand, remember, and utilize auditory information.. Can they “keep up” when people talk very fast? Can they tell voices apart easily (even on the phone)? Can they imagine the voices of familiar people in their head? Can they remember information that they hear?
Auditory Processing involves:
hearing differences between sounds/voices remembering specific words or numbers remembering general sound patterns understanding even when they miss some sounds blending parts of words together music
Students with a general auditory processing disability usually have most difficulty with general reading, general writing, and language (understanding and expressing). Specific difficulties may include:
- reading poor decoding of new words poor comprehension - writing poor spelling/mechanics poor sentence structure - communication difficulty with expression poor receptive language - general difficulty following oral directions difficulty learning in lectures
Sequential/Rational processing is generally regarded as the brain's detailed filing system. It involves the ability to learn, memorize, organize, and express detailed or specific information including facts, figures, and formulas.
This is very much like a computer organizes and stores information. How well does a student remember details (like names, addresses, facts, etc.)? How organized are they?
Students with poor sequencing skills may benefit from external structure (such as lists, schedules, reminders, etc.). Such students also sometimes have stronger conceptual processing abilities (reasoning, abstract thinking, creativity) and may learn best when first presented overviews, summaries, and underlying concepts rather than detailed facts.
Sequential/Rational processing involves:
Short-term memory for details long-term retrieval of details fine-motor coordination finding the words you want to say or write organization of your thoughts and materials writing mechanics (spelling, punctuation) reading speed/sounding out new words attention to details putting words and thoughts in order
Students experiencing a general Sequential/Rational processing disability often have most learning difficulties in the areas of basic reading, math computation, expressive language, and writing mechanics. Specific difficulties may include:
- handwriting speed/clarity letter reversals spelling/mechanics letters in wrong sequence (order) - reading decoding (sounding our words) speed/fluency remembering details attention/concentration - math remembering formulas/steps - communication finding words for verbal or written expression - general planning lengthy assignments remembering details paying attention - easily distracted by surroundings remembering names of people or objects following specific directions
Conceptual/Holistic processing involves understanding “the big picture”, overall patterns and underlying concepts for use in higher-order thinking, creating, and reasoning.
Conceptual/holistic filing is like throwing things into boxes with very general labels.
Conceptual/Holistic (right-brain) processing involves:
memory for general themes or ideas reasoning spatial awareness general knowledge inferential thinking estimation/approximation conceptual understanding creativity/inventiveness reading comprehension use of context rhythm music art
Students experiencing a general conceptual/holistic processing disability often perform quite well during early school years but later experience difficulty with reading comprehension, math reasoning, and creative writing. Specific difficulties may include:
- reading understanding irony, inferences, sarcasm general comprehension - math generalizing to new situations story problems - written language creative writing - communication general language comprehension understanding humor - general global/general awareness attention - may focus too much on a specific area
Processing Speed involves how quickly the brain is able to act or react in various situations. Problems can arise when information is either processed too slowly (i.e. the subject can't keep up) or too quickly (i.e. the subject responds impulsively or carelessly).
All LD students experience some processing speed difficulty when required to process information through their weakest processing “channel” or “modality”. But for other LD students, a general weakness in processing speed causes difficulty in all areas.
It is like having the brain work at 40 miles per hour when the rest of the world (and all the information) is going 55 miles per hour. Such students just can’t keep up.
Relatively low Processing Speed is sometimes associated with ADHD - Inattentive type while relatively high Processing Speed is sometimes associated with impulsivity which can be a characteristic of ADHD – Hyperactive type.
Processing Speed involves:
short-term memory (with time pressure) long-term retrieval (with time pressure) talking speed, word-finding writing speed reading speed attention reasoning (with time pressure) general response speed
Students experiencing a general Processing Speed disability often have learning difficulties in all academic areas due to their inability to process all types of information quickly. Specific difficulties may include:
- reading reading speed ability to stay focused while reading - math completing a series of problems - written language writing speed mechanics clarity (with time pressure) - communication delays in responding slow, deliberate speech word-finding difficulties - general coping with implied or expressed time pressures always "a step behind" difficulty maintaining attention to tasks exceeding time limits during tests trouble with social pressures to perform "faster"
Executive Functioning refers to the overall ability to manage or regulate all of the various cognitive and emotional processes. This involves initiation, planning, organization, and execution of various tasks as well as the ability to cope with transitions or regulate emotional responses. Weakness in this area is often associated with an attention deficit disorder.
Executive Functioning skills involve:
ability to stay focused on tasks ability to plan and anticipate organization of thoughts and materials ability to follow-through and complete tasks ability to cope with unstructured situations ability to cope with changes in routine ability to regulate emotions
Students experiencing general Executive Functioning difficulties often struggle academically with work-completion, organization, and motivation for any task which is perceived as difficult, frustrating, or simply unappealing. Specific difficulties may include:
- reading motivation when material is “boring” speed/fluency - skipping words or lines remembering details attention/concentration - math difficulty seeing the “relevance” difficulty maintaining motivation to complete practice worksheets - general planning lengthy assignments remembering details paying attention - easily distracted by surroundings completing assignments following specific directions ability to keep school a “priority”
The CPI as Part of a
Comprehensive LD Assessment
As mentioned previously, the CPI is not intended to be used in isolation to
identify LD students but is ideally suited as one component of a broader
educational assessment. It may be
most appropriate to use the CPI as a pre-referral screening measure to provide
an initial indication of a student's learning/processing style followed by more
comprehensive cognitive and academic assessment if indicated.
Obviously, the goal of any assessment is to obtain data across settings
which consistently points in the same interpretive direction. In order for this to occur, it is very
important that all forms of data be interpreted in terms of the same
information processing model.
The CPI and Achievement: Table 4.1 is provided to
demonstrate the relationship between the processing model of the CPI and
specific areas of academic achievement.
Table 4.1
Correlation Between CPI Processing and
Achievement
This relationship demonstrates one of the
greatest strengths of the CPI processing model. It is not only possible, but also relatively easy to
differentiate between various subtypes of learning disabilities in order to
understand the cause of a student's specific learning problems and promote
appropriate and effective intervention. This can be accomplished informally as part of the pre-referral process
or formally in conjunction with individual achievement test results.
The CPI and cognitive testing: Table 4.2 displays the relationship between the CPI processing model and
the various subtests of the Wisc-IV and Woodcock-Johnson III as suggested by
numerous factor-analytic and empirical research studies. Note: The CPI computerized software package allows entry of
objective test data from all current Wechsler scales (IQ and achievement),
Woodcock-Johnson III tests of Cognitive Ability and Achievement, the
Stanford-Binet (IV & V), and the Differential Abilities Scale (DAS 1 &
2). This data can then be directly
compared to CPI rating data for broader interpretation.
Table 4.2
Correlation Between CPI Processing and Formal
Cognitive Assessment
As Table 4.2 suggests, differing patterns of subtest scatter within formal
cognitive assessment batteries may be indicative of various forms of
information processing difficulty.
When the same overall pattern of information processing is demonstrated
within achievement testing, cognitive assessment and the CPI, diagnostic
confidence is clearly enhanced.
General Caution: There is no
pure measure of any specific area of information processing. In other words, there can never be any
one task designed to exclusively evaluate a student's abilities in a specific
processing area. Although some
types of tasks are "generally" regarded as heavily favoring one type
of information processing over another, every individual task requires, or at
least can be performed with, alternative or combinations of processing
skills. This is why it is
extremely important to always take a very broad perspective of all available
information related to a student's processing pattern and never base decisions
entirely upon how a student performs on a single task or activity.
Rating and Scoring the CPI
The CPI consists of a two-page, 65-item
checklist (see Appendix A) which includes 15 items pertaining to background
information and 50 items which are used to provide scores in the various
cognitive processing domains. When
completed by parents, this checklist is typically sent home along with a brief
explanation of the intent and purpose of the rating. When completed by students, the checklist can either be
given to them directly to complete by themselves, or it can be read to them
with their responses recorded by a teacher, psychologist, etc. It is important to note that each and
every item must be completed. Raters should be instructed to use a rating of "3" when
uncertain about the correct response. This will minimize the impact of incorrect "guesses".
Who should rate the student? Normally, behavior rating scales such
as the CPI are completed by teachers familiar with the student. However, since the CPI requires a
long-term and in-depth understanding of how a student functions in his or her
every-day life, the most reliable ratings are obtained from parents. In addition, students aged 12 or above are usually able to provide
reliable and accurate ratings of themselves (norms are also provided for
younger self-ratings although those results should be viewed with
caution). When both student and
parent ratings are completed, it has been found that both ratings typically
indicate the same general processing pattern although the raw scores for the
student rating, in general, tend to be a bit higher than those of the parent
rating. This probably reflects the
reluctance of students to admit the severity of their own difficulties. Of course, the tendency of students to
minimize their difficulties on the CPI is corrected when raw scores are
converted to standardized scores for comparison and interpretation. Teacher ratings tend to minimize both
strengths and weaknesses due to a tendency to over-utilize the rating of
"3" when uncertain of the correct rating for a given item. For this reason, the CPI is only
recommended for use as a teacher rating if the teacher has considerable
long-term knowledge and understanding of the student.
Scoring the CPI:
Computer Scoring: Computer scoring is easily accomplished with the CPI scoring program
which is included as part of the standard professional CPI package. Computer scoring involves simply
entering the raw rating data (plus any additional objective test data which may
be available) into the appropriate fields of the CPI scoring program. The computer then calculates the
standardized scores, generates a graphic display of the data, provides a
written interpretation of the results, and generates an extensive list of
recommendations based upon the information processing pattern found. Examiners can chose to edit the
recommendation choices if desired. The computer program also allows entry and comparison of multiple
ratings from different sources and provides a statement of the apparent
validity of each rating (based primarily upon the variability of item
scores). This can be extremely useful
when inconsistency is found among raters.
Detailed instructions for installation and use
of the CPI professional software is provided in Section 7 of this manual.
Interpretation of the CPI
Once you have gained a basic understanding of
the processing components of the CPI (see section 3), interpretation is fairly
obvious and straight-forward. Remember, the CPI is not intended to be used as an isolated instrument
to identify learning disabled students. But the CPI clearly can be an important tool to help with such placement
decisions and to clarify a strategy for educational intervention, even for
students who are found not eligible for special education services.
Interpretation of the processing scales: After the CPI ratings have been entered into the computer scoring program
a visual display of processing skills is provided. Interpretation can be performed rather informally by simply
looking for relative strengths and weaknesses across the 6 processing areas. But the computer scoring program also
generates fairly extensive interpretive statements.
Significance of differences –
intra-cognitive interpretation: As mentioned in Section
2, by default, Standard
Deviation of Difference (SDD) scores are provided to assist with the
interpretation of the significance of differences (within the individual
subject) between standard scores in each processing domain and the Global
Processing Index. The
computer-generated report automatically calculates the number of SDDs that a
specific processing standard score falls above or below the Global Processing
Index. For example, if the GPI is
100, the Auditory Processing SS is 88, and the SDD value for that rating is
8.0, that translates to a difference of -1.5 SDDs. This would suggest that Auditory Processing is moderately
discrepant from the GPI indicating an apparent relative weakness in this
area. For interpretation,
"moderate discrepancy" is found in the range of 1 to 2 SDDs (either
positive or negative) from the GPI. 2 or more SDDs from the GPI represents a "severe discrepancy" and
would indicate either a significant strength or significant weakness in that
processing area. Besides the SDD
which has just been discussed, the CPI also provides SDD scores pertaining to
differences between dichotomously paired processing domains. These would include: Auditory
Processing vs Visual Processing, and Sequential Processing vs Conceptual
processing. Again, 1 or more SDDs
between these processing areas would indicate a moderate to severe difference. The significance of any differences is identified
and clarified by the computer scoring software.
Significance of differences –
inter-cognitive interpretation: As mentioned in Section 2,
examiners are given the option of basing interpretations on inter-cognitive
comparisons if desired. Inter-cognitive
comparisons simply involve comparing a subject’s standard scores in each
processing area with the mean standard score of the norm group (100). For interpretation, standard scores
between 70 and 85 would be considered “moderately discrepant” and scores below
70 would be considered “severely discrepant” from the mean of the norm
group. Although this is not the
recommended interpretive process, it may help to differentiate among
generalized processing issues (when all scores are relatively low and
intra-cognitive comparison identifies no significant processing pattern).
Statistical Significance vs Logical
Significance:
The paragraphs above refer to "statistical
significance" which is commonly used by practitioners as a convenient
means of establishing the "probability" that a difference in scores
actually represents a real difference in skills. Although establishing this statistical probability certainly
provides an objective means of interpreting the data, too often such values or
formulas are used as the primary, if not sole basis for determining eligibility
or placement decisions. In
reality, for some individuals, differences less than the
"significant" value may actually represent a "severe" area
of difficulty. On the other hand,
other individuals may be able to cope very well even with rather high
statistical differences. Ultimately, it is important for the examiner and/or assessment team to
compare relative strengths and weaknesses indicated on the CPI (even
differences of less than 1 SDD) with other data available (from cognitive
assessment, achievement assessment, background information, behavioral
observation, etc.) in order to determine the consistency and "logical
significance" of any pattern found. In many ways, this logical significance is far more valuable than
statistical significance when making important educational decisions.
Caution regarding "gifted"
individuals: One of the more intriguing aspects of
learning disabilities is the fact that every person has some capacity to compensate
for his or her processing weakness(es). This is especially true of bright or "gifted"
individuals. It is quite possible
for such a person to effectively conceal his or her learning difficulties from
teachers and parents, at least for a while. It is also quite possible for such a person to compensate
quite well during formal cognitive assessment, even on tasks that would
normally involve their greatest processing difficulties. For this reason it is especially
important for assessment teams to take a very broad perspective when looking
for processing patterns in bright students or adults. Don't be fooled by a person's ability to effectively conceal
his or her difficulties. Cognitive
processing patterns (either from formal cognitive assessment or from the CPI)
will often underestimate the real severity of an information processing
disability for bright or gifted individuals.
Interrelationship across processing
clusters: As mentioned previously, there can be
no pure measure or rating of any distinct area of information processing. For example, by definition, general
sequential processing involves a combination of visual sequencing and auditory
sequencing. Therefore, a weakness
in general sequencing would naturally impact both general visual and general
auditory processing to some extent. Obviously, a similar relationship is found among conceptual, visual, and
auditory processing areas. For
this reason, often the most relevant comparisons will be between the 2
dichotomously related processing areas (sequential vs conceptual and visual vs
auditory). The area of processing
speed is somewhat related to all of the other processing areas because a
weakness in any of the other areas will naturally result in somewhat slower
processing of some types of information. Similarly, a subject may not be able to demonstrate effective executive
functioning if there is also some other area of information processing
weakness.
Because of these interrelationships, several
areas of relative processing weakness may be indicated for some
individuals. In these cases it is
important to look both at the severity of the weaknesses indicated along with
how well each area of suggested difficulty "fits" with the learning
difficulties experienced by the person. In some cases the ultimate interpretation will be reduced to one
processing area whereas in other cases all indicated processing areas may be
appropriately identified as relative weaknesses. What is most important is that the ultimate interpretation
"makes sense" from the standpoint of what is commonly known and
understood about the particular person being rated.
Relationship between LD and ADD or ADHD: There are numerous references in research literature about the
relationship between learning disabilities and attentional difficulties. This relationship really isn't very
surprising given the characteristics of the various forms of information
processing disability. For example,
a weakness in sequential processing (probably the most common processing
problem for LD students) naturally results in some difficulty focusing on
details along with a tendency to be overly sensitive to general surrounding
distractions. Similarly,
weaknesses in visual or auditory processing naturally result in some difficulty
maintaining attention to either visual or auditory instruction. Conversely, a student with an attention
deficit disorder naturally will experience difficulty attending to, and
therefore "processing" various types of information.
Using the CPI to screen for ADD or ADHD: Research (both within and beyond the CPI) has suggested a relatively
strong correlation between low processing speed and passive inattention (or
ADHD Inattentive Type). Conversely, high processing speed often suggests impulsiveness which
correlates highly with ADHD Hyperactive Type. Similarly, executive functioning difficulties have been
implicated as common characteristics among the ADHD population. Although such cluster comparisons may
be suggestive of broader attentional concerns, the CPI is not intended to
provide a diagnosis of attention deficit disorders.
A word about Conceptual processing: Although the area of conceptual processing has been firmly established
in research and has a clearly dichotomous relationship with sequential
processing, very few identified LD students are found to actually have a
weakness in conceptual processing. In fact, for most identified LD students, conceptual processing
represents their greatest strength. This probably relates to the fact that the basic academic skills
emphasized in elementary grades (when most learning disabled students are
identified) rely heavily upon sequential processing. Students with conceptual processing difficulties are often
able to learn and memorize detailed information, can read and spell quickly and
easily, and can remember basic math formulas. The difficulty these students have with conceptualization
often does not become apparent until secondary grades when they begin to
struggle with underlying concepts, inferential thinking, creative writing, and
abstract problem-solving.
Evaluating the impact of culture, language, or other environmental factors: Whenever attempting to diagnose a learning disability it is important to rule-out factors other than a true learning disability which may be negatively impacting a student’s education. Beginning with version 6.0, the CPI provides support for identifying and ruling out such factors. First, the rating forms solicit background and demographic data which helps to identify potential rule-out factors such as behavioral interference, inconsistent educational exposure, lack of instruction in English (either due to schooling in a foreign country or in a foreign language immersion program), lack of English language fluency, or something other than English as the primary language spoken at home. Any identified rule-out factors are then listed on the report to be taken into consideration by the examiner. Second, the CPI report includes a Culture/Language Impact index (both on the graphic display and within the report text) to provide an objective measure of the apparent impact of cultural or language issues. By default, the Culture/Language Index is displayed whenever potential issues of culture or language are identified on the rating form. A checkbox is provided on the Report Preview screen for the examiner to manually include or exclude the Culture/Language index as desired. Note – due to the obvious overlap between the Culture/Language index and certain information processing domains (especially the auditory processing index), it is not possible to ever fully rule in or rule out the impact of cultural or language issues. By “rule of thumb”, if the Culture/Language index falls within or above the average or “normal” range (i.e. above -1.0 SDD) you can be fairly confident that issues of culture or language are not significantly impacting the student. On the other hand, if the Culture/Language index shows at least “moderate concern” and is lower than any of the information processing indexes, it is quite possible that issues of culture and/or language are primary factors impacting the student’s academic progress.
Installation and Use of the CPI
Professional Software
Installation:
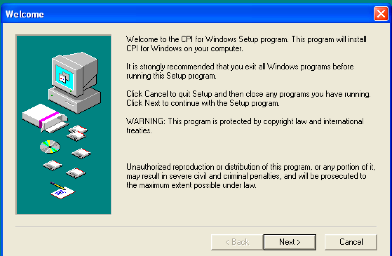
If the CPI software package was
downloaded from the web site, your web browser probably unstuffed the file and
created the appropriate CPI installer (for Mac or Windows) on your hard drive.
Whether installing from the downloaded installer or from the CD-ROM, simply
open the installer and follow the on-screen instructions.
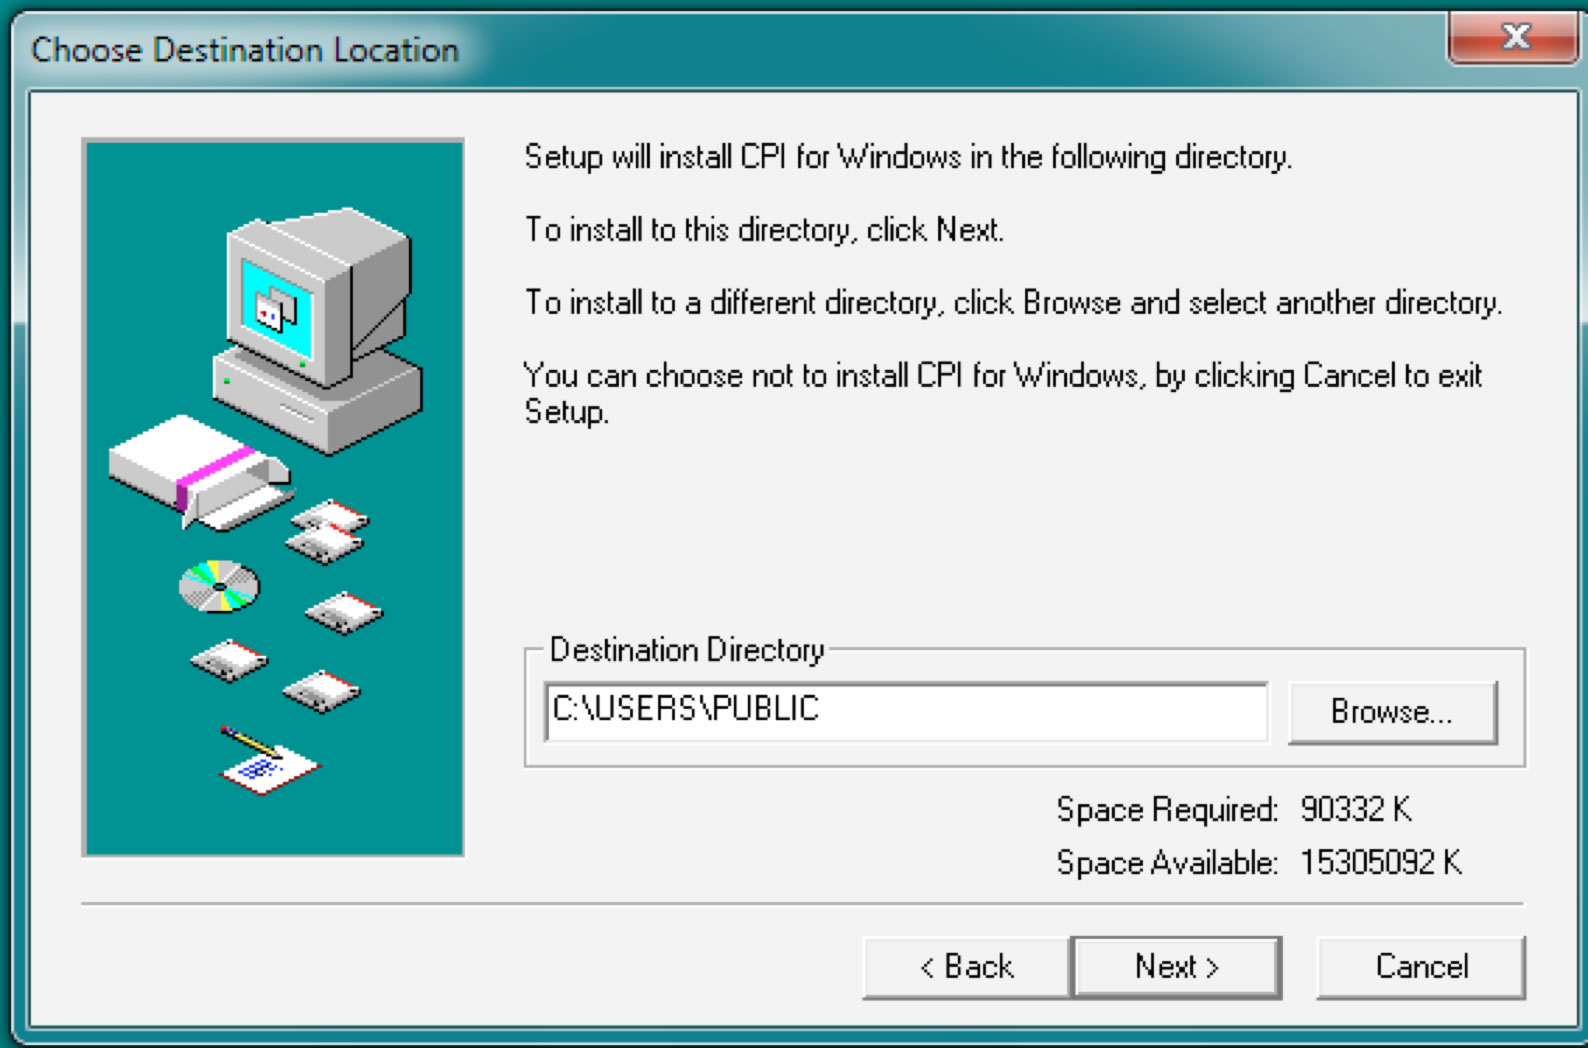
During installation, by default
the CPI package is placed either in the 'Program Files' directory (Windows) or
in your main hard drive directory (Macintosh) unless you select a different
location.
An 'alias' or 'shortcut' is also
created on your Windows desktop or Macintosh Dock for easy access to the CPI
application.
Important: Always be sure that all
files related to the CPI scoring application remain inside the CPI Pro
folder/directory where they first exist. If these files are moved, the scoring program and/or registration codes
may not function properly.
Using the CPI:
To begin using any of the CPI
materials (scoring file, forms, manual, instructions, etc.) simply double-click
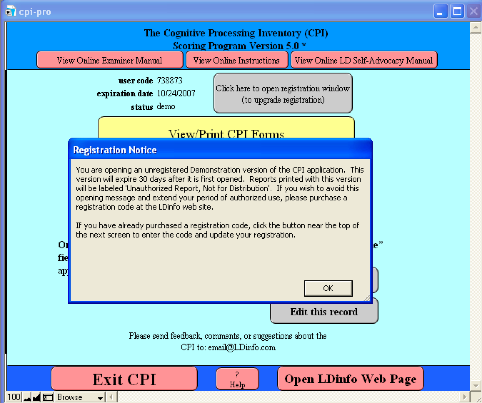
the CPI Pro application or the desktop shortcut (or alias). If you are opening a demonstration
version of the application, you will first be presented a popup message
describing the limitations of that version along with options for upgrading
your registration.
Simply click “OK” in the
“Registration Notice” window in order to proceed to the actual
application.
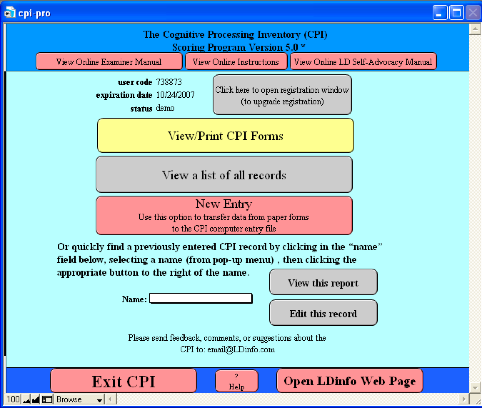
If you have purchased a
registration code, click the button near the top of the next screen (shown
below) to enter the code and register the software.
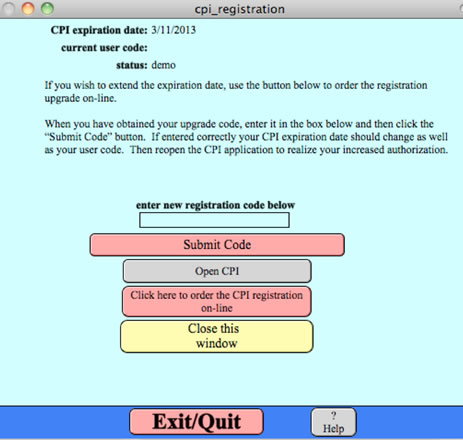
This will open a separate
registration window where you can enter your registration code.
After entering a valid
registration code, you will be presented a “Thank You” message. Simply click “OK” on that message and
the software will reopen to complete the registration process.
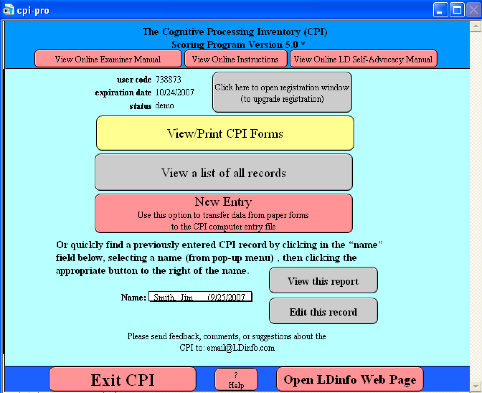
If you are using a registered version
of the CPI, the application will open directly to the screen which gives
various options including viewing/printing forms, starting a new entry or
viewing a list of existing entries.
If you are wishing to view or edit
an existing entry you can simply select the name of the subject from the
drop-down list and click the appropriate button to the right of the name.
Completing an entry on a new
subject is accomplished in 4 easy steps as follows:
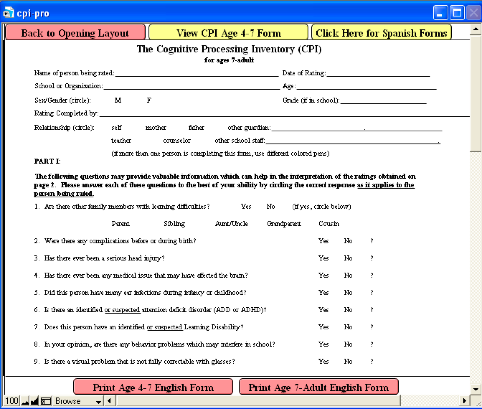
Step 1: From the opening screen
click the button entitled 'View/Print CPI Rating Forms'. A new window will open
in which you can preview and/or print the various paper rating forms. You may
either print 1 copy of each form and then duplicate them as needed or just
print new forms as you need them. In either case, the printed forms will note
the expiration date for you to legally print or duplicate the forms (based upon
your registration status).
Step 2: Distribute CPI rating
forms to parents, teachers, and/or subjects and collect the completed forms for
scoring.
Step 3: To score completed CPI
forms, simply open the CPI Pro application and click the 'New Entry' button.
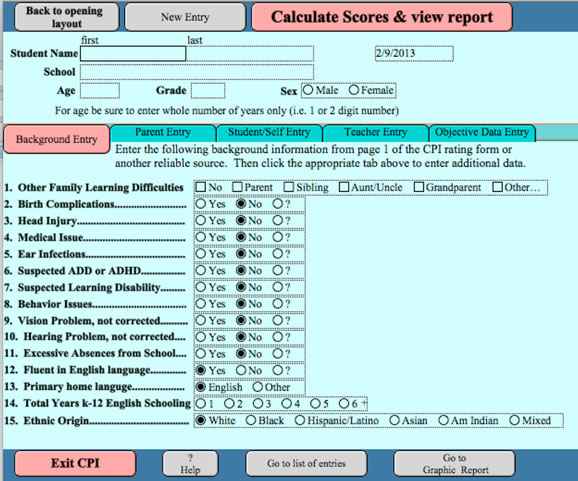
A new window will open which
allows entry of subject information including name, age, grade, school, etc. Be
sure to enter an age in whole years (no dashes, decimal points, months, etc.)
and sex so that the norm-referenced scores can be accurately calculated.
Then select the appropriate button
below that section to begin entering actual rating data (from parent, teacher,
or self-ratings).
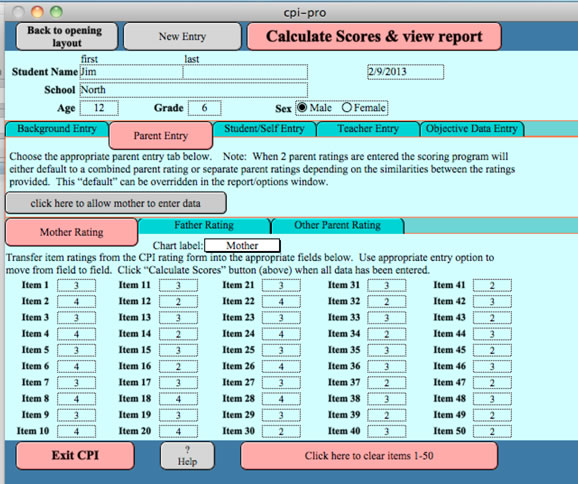
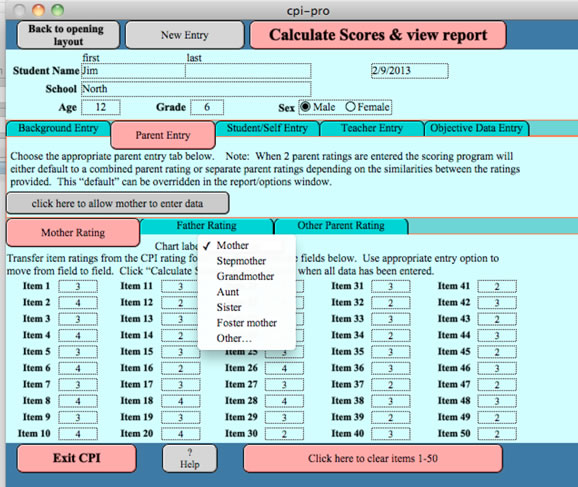
For each parent entry you may
select from a list of parent/guardian types to be used as the label in the
interpretive chart and descriptions.
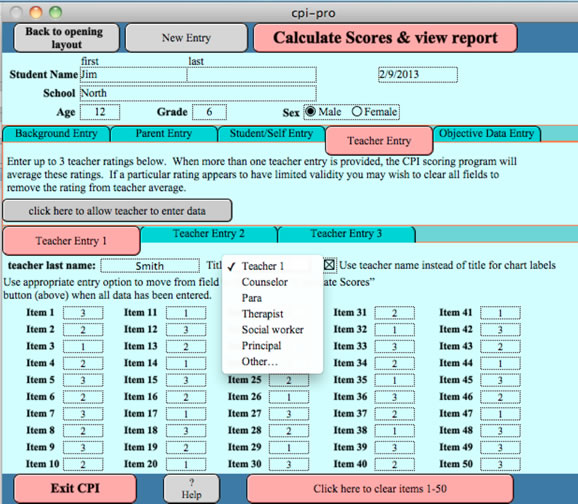
You may enter multiple ratings for
each subject (i.e. parent, teacher, and/or student/self ratings) in order to
directly compare results on the graphic display provided in the report.
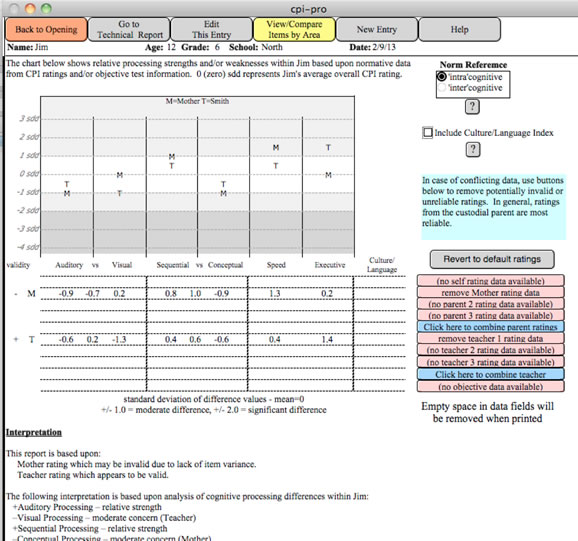
Step 4: When available ratings
have been entered, simply click the 'Calculate Scores/View Report' button at
the top of the window. A new window will open in which you can preview graphic
displays of each rating category, combine or separate parent or teacher ratings
or exclude certain ratings. You may also select the level of significance
required for interpretation as described below.
The default interpretation is
based upon intra-cognitive differences (within the subject) based upon the
significance of such differences found within the norm group. Although this is clearly the most
appropriate interpretive option, in rare cases you may wish to switch to the
alternate inter-cognitive comparison (using the button in the top right corner
of the screen) which will simply base interpretations on differences between
obtained standard scores and the mean of the norm group (100).
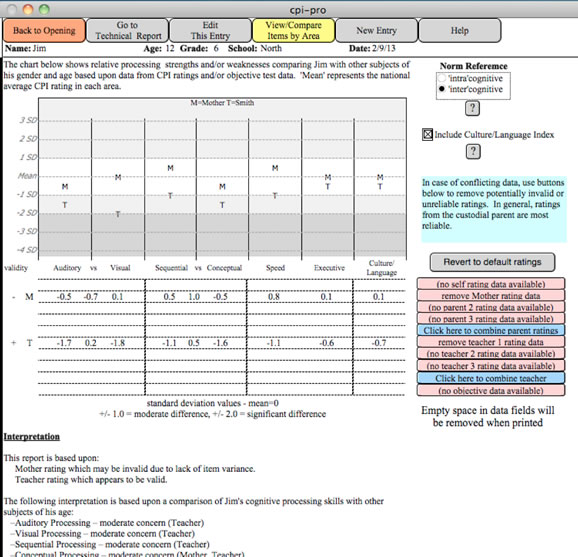
To the right of the graphic display and data chart are additional buttons allowing you to combine/separate multiple parent or teacher ratings or exclude specific ratings (possibly due to low validity). Combining/Separating parent or teacher ratings: By default, the CPI scoring program combines highly similar parent ratings and separates dissimilar ratings. You can override this selection simply by clicking the appropriate button to the right of the data chart. By default, any available teacher ratings are combined to provide a display of the average teacher rating. Again, you can override the default selection by simply clicking the appropriate button to the right of the data chart. Excluding Certain Ratings: If it is felt that a given rating may be invalid (and inappropriately skew the overall results or cause confusion) that rating can simply be excluded from the charts and interpretations by clicking the appropriate button to the right of the data chart. Any excluded rating can be 'included' again by simply clicking the same button.
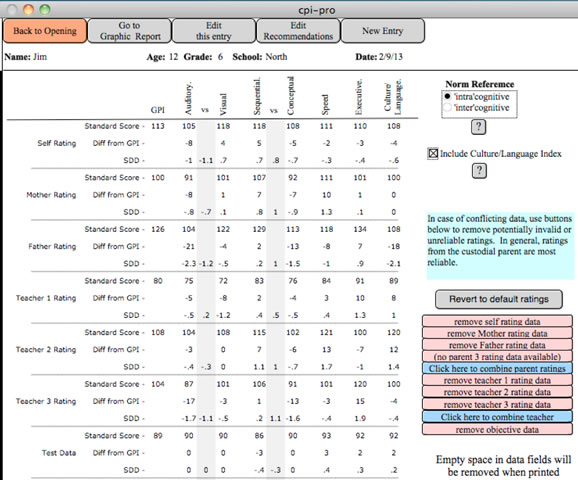
Optional Technical Report: From the Graphic Report screen you may view a somewhat more technical report layout by clicking the appropriate button at the top of the screen.
This report provides the actual
standard scores standard deviation of difference (SDD) scores, and global
processing index (GPI) scores for each specific rating along with the overall
interpretation summary.
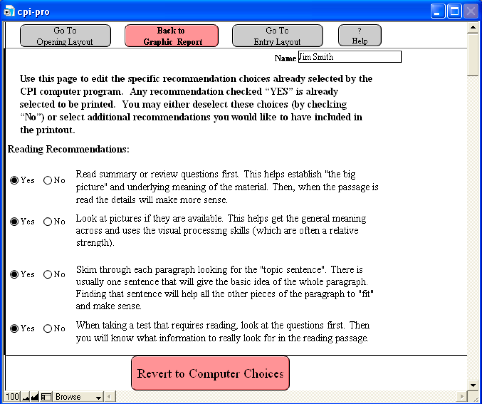
From any of the report screens you
may choose to view and/or edit computer-generated recommendations by clicking the
appropriate button at the top of the screen.
Then you may scroll through all
possible recommendations and select (by clicking “yes”) or deselect (by
clicking “no”) those which are deemed appropriate.
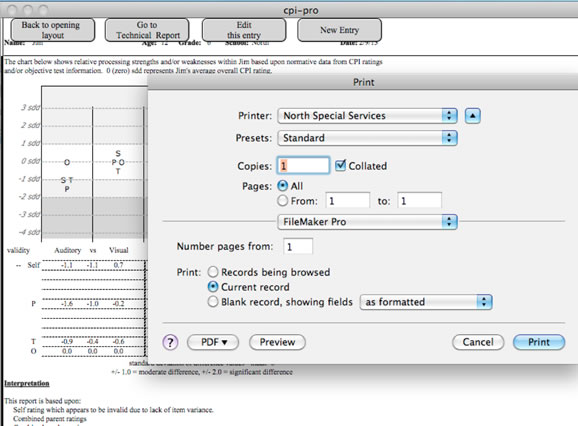
Printing Reports:
Various print/save buttons are
included in any layout which can be printed (usually at the bottom of the
page).
Clicking the chosen print button
will bring up your normal print screen giving you options such as number of
copies, which pages to print, etc. Be sure the page range is set appropriately for the pages you wish to
print.
Note: For best viewing and printing results the Times New Roman
font should be installed on your computer.
Saving Reports:
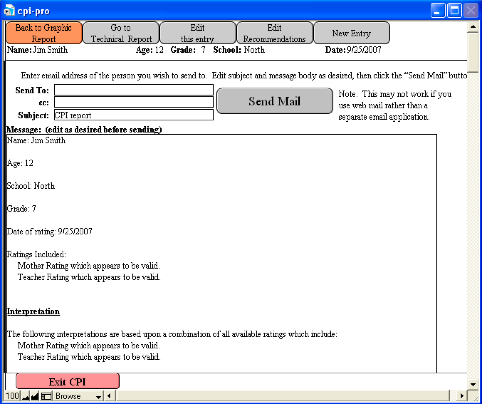
You may also email the report text.
Sending report text via email is
accomplished by simply clicking the “Send as Email” button at the bottom of the
report screen or selecting the appropriate option from the “Scripts” menu. This option only works if your computer
is set up with a default email application.
In the screen which opens, simply
enter a valid email address and edit the subject and message body as desired
before clicking the “Send Mail” button. After clicking this button a popup message will inform you that the
message has been placed in the outbox of your email application. You will then be automatically returned
to the Graphic Report screen.
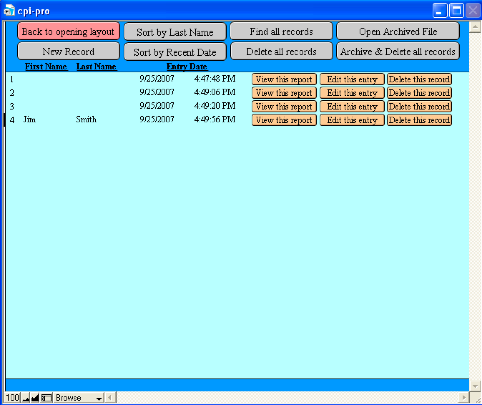
Deleting Records:
If you would like to delete any or
all of the records in your CPI file (possibly to start fresh each school year),
from the opening screen select the “View List of Records” button. The screen below will open showing you
a list of all available records. From this list you may either delete individual records or select the
button at the top to delete all records.
If you would like to delete all
records but also save an archived copy of the file (for later review) select
the “Archive & Delete all records” button.
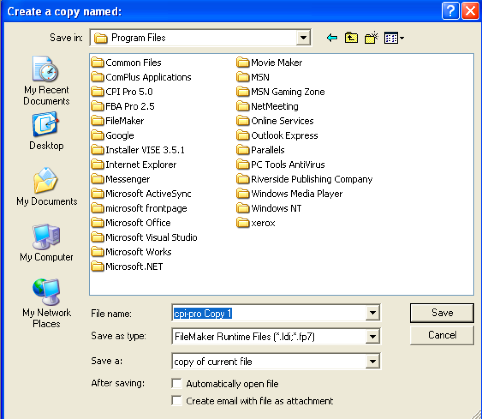
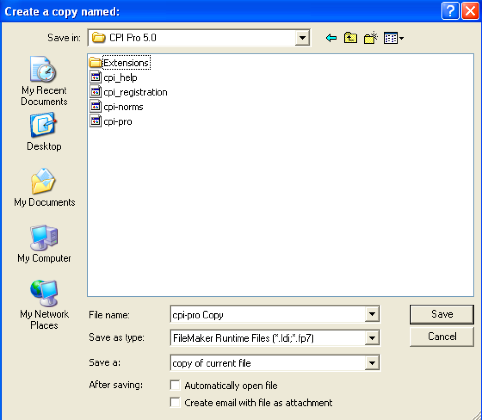
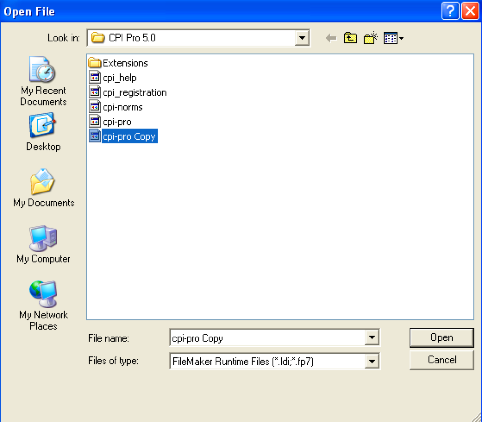
This option will open a window
asking you to select a location for saving the copied file. Be sure to navigate to the CPI Pro
folder/directory. This
location can be found on Windows/PC computers in the Program Files directory
of your C Drive (unless you chose
a different location during installation). For Macintosh users, the CPI Pro folder/directory is located
in your Applications folder (unless you chose a different location during
installation).
You may also rename the saved file
as you see fit (perhaps including the year or date saved).
At a later date when you wish to
reopen the archived file, simply select that option from the top of the “View
List of Records” CPI screen and navigate to the CPI Pro folder/directory to
open the desired file.
This archived file will open
directly in front of the current CPI screen and you can navigate from one file
to the other by using the “Window” menu. Both files will close when you exit the CPI application.
Free Trial Period/Registration
Code:
All LDinfo software is provided either through entirely online Apps (which work with any internet browser from anywhere) or downloaded applications (compatible with Windows OS, MacOS, or IOS). Initially, these apps or applications are provided a no cost and with sufficient functionality in order for you to fully evaluation their potential usefulness for your particular needs.
In order to unlock full professional functionality you would need to purchase a registration code with varying pricing options depending on number of software users and desured length of registration (from 6 months to 3 years). Click here to view pricing options.
You may always increase your length of authorized use by purchasing a new registration
code (instructions for purchasing this code are provided on the www.LDinfo.com web site) and entering this
code iwithin the specific LDinfo App or application.
CPI Forms: During your period of
authorized use you may view, print, and duplicate any CPI forms which you may
need.
There is a button near the top of
the CPI application main window which will allow you to view and/or print CPI
rating forms. There are 2 versions of the rating forms, one for parents or
teachers to complete and the other for subjects to rate themselves (not
recommended for children younger than age 10).
You may either print 1 copy of
each form and then duplicate them as needed or just print new forms as you need
them. In either case, the printed forms will note the expiration date for you
to legally print, duplicate, or distribute them (based upon your registration
status).
NOTE: Reports cannot be printed during the free trial
period or after your registration period has expired .
References
Ackerman, P. T., &
Dykman, R. A. (1993). Phonological processes,
confrontational
naming, and immediate memory in dyslexia. Journal of Learning
Disabilities, 26,
597-609.
Batchelor, E., Grey,
J., & Dean, R.S. (1990). Neuropsychological aspects of
arithmetic performance
in learning disability. International Journal of
Clinical
Neuropsychology, 12, 90-94.
Branch, W. B., Cohen, M. J., & Hynd, G. W. (1995). Academic achievement
and attention-deficit/hyperactivity disorder in children with left- or
right-hemisphere dysfunction. Journal
of Learning Disabilities, 28, 35-43.
Cohen, M. J. (1988).
The revised Conners Parent Rating Scale: Factor
structure replication
with a diversified clinical sample. Journal of Abnormal
Child Psychology, 16,
187-196.
Cohen, M. J., DuRant,
R. H., & Cook, C. (1988). The Conners Teacher Rating
Scale: Effects of age,
sex, and race with special education children.
Psychology in the
Schools, 25, 195-202.
Cornwall, A. (1992).
The relationship of phonological awareness, rapid
naming, and verbal
memory to severe reading and spelling disability. Journal
of Learning
Disabilities, 25, 532-538.
Das, J.P. (1973).
Structure of cognitive abilities: Evidence for simultaneous
and successive
processing. Journal of Educational Psychology, 65, 103-108.
Das, J.P. (1984).
Simultaneous-successive processes and K-ABC. The Journal of
Special Education, 18,
627-634.
Das, J. P., Kirby, J.
R., & Jarman, R. F. (1979). Simultaneous and successive
cognitive processes.
New York: Academic Press.
Das, J. P., & Siu,
I. (1989). Good and poor readers' word naming time, memory
span, and story
recall. Journal of Experimental Education, 57, 101-114.
Das, J. P., Kirby, J.
R., & Jarman, R. F. (1975). Simultaneous and successive
synthesis: An
alternative model. Psychological Bulletin, 82, 87-103.
Das, J. P., Mishra, R.
K., & Kirby, J. R. (1994). Cognitive patterns of
dyslexia: Comparison
between groups with high and average nonverbal
intelligence. Journal
of Learning Disabilities, 27,
235-242.
Das, J. P., &
Naglieri, J. A. (1992). Assessment of attention,
simultaneous-successive
coding and planning. In H. C. Haywood & D. Tzuriel
(Eds.), Interactive
assessment (pp. 207-232). New
York: Springer-Verlag.
Das, J. P., Naglieri,
J. A., & Kirby, J. R. (1994). Assessment of cognitive
processes. Needham
Heights, MA: Allyn & Bacon.
Denckla, M. B., &
Rudel, R.G. (1976). Rapid "automatized" naming (R.A.N.):
Dyslexia
differentiated from other learning disabilities. Neuropsychologia,
14, 471-479.
Denckla, M. B. (1989).
Executive function, the overlap zone between attention
deficit hyperactivity
disorder and learning disabilities. International
Pediatrics, 2,
155-160.
Duffy, F. H., Denckla,
M. B., Bartels, P. H., & Sandini, G. (1980). Dyslexia:
Regional differences
in brain electrical activity by topographic mapping.
Annals of Neurology, 7(5), 412-420.
Eden, G. F., Stein, J.
F., & Wood, F. B. (1993). Visuospatial ability and
language processing in
reading disabled and normal children. In S. F. Wright
& R. Groner
(Eds.), Facets of dyslexia and its remediation: Studies in visual
information processing
(pp. 321-335). Amsterdam: North-Holland.
Elliot, C. D. (1990). Differential Ability Scales: Administration and scoring manual. San Antonio, TX: Psychological Corporation.
Feagans, L. V., &
McKinney, J. D. (1991). Subtypes of learning disabilities:
A review. In L. V.
Feagans, E. J. Short, & L. J. Meltzer (Eds.), Subtypes of
learning disabilities:
Theoretical perspectives and research (pp. 3-31).
Hillsdale, NJ:
Erlbaum.
Felton, R. H., Wood,
F. B., Brown, I. S., & Campbell, S. K. (1987). Separate
verbal memory and
naming deficits in attention deficit disorder and reading
disability. Brain
and Language, 31, 171-184.
Fisk, J. L., &
Rourke, B. P. (1979). Identification of sub-types of
learning-disabled
children at three age levels: A neuropsychological,
multivariate approach. Journal of Clinical Neuropsychology, 1, 289-310.
Fletcher, J. M., &
Loveland, K. A. (1986). Neuropsychology of arithmetic
disabilities in
children. Focus on Learning Problems, 8, 23-40.
Flowers, D. L., Wood,
F. B., & Naylor, C. E. (1991). Regional cerebral blood
flow correlates of
language processing in reading disability. Archives of
Neurology, 48,
637-643.
Grafman, J.,
Passafiume, D., Faglioni, P., & Boller, F. (1982). Calculation
disturbances in adults
with focal hemispheric damage. Cortex, 18, 37.
Hammill, D. D. (1985). Detroit tests of learning aptitude-2. Austin, TX:
PRO-ED.
Hooper, S. R., Hynd,
G. W., & Tramontana, M. G. (1988). Visual-spatial
dyslexia: A
neuropsychological case report. Neuropsychology, 2, 135-143.
Hynd, G. W., &
Cohen, M. J. (1983). Dyslexia: Neuropsychological theory,
research and clinical
differentiation. Orlando, FL: Grune & Stratton.
Kaufman, Alan S. (1994). Intelligent
Testing with the WISC-III/Allan S. Kaufman. New York: Wiley.
Kaufman, A. S., & Kaufman, N. L. (1983). Kaufman Assessment Battery for Children: Administration and Scoring Manual. Circle Pines, MN: American
Guidance Service, Inc.
Kaufman, D., &
Kaufman, P. (1992). Strategy training and remedial techniques.
Journal of Learning
Disabilities, 16, 72-78.
Kirby, J.R., &
Das, J.P. (1977). Reading achievement, IQ, and
simultaneous-successive
processing. Journal of Educational Psychology, 69,
564-570.
Kirby, J. R., &
Das, J. P. (1990). A cognitive approach to intelligence:
Attention, coding and
planning. Canadian Psychology, 31, 320-331.
Kirby, J. R., &
Robinson, G. L. W. (1987). Simultaneous and successive
processing in reading
disabled children. Journal of Learning Disabilities,
20, 243-252.
Korhonen, T. (1991).
Neuropsychological stability and prognosis of subgroups
of children with
learning disabilities. Journal of Learning Disabilities, 24,
48-57.
Levin, B. (1990).
Organizational deficits in dyslexia: Possible frontal lobe
dysfunction. Developmental
Neuropsychology, 6, 95-110.
Lou, H. C., Henriksen,
L., & Bruhn, P. (1984). Focal cerebral hypoperfusion
in children with
dysphasia and/or attention deficit disorder. Archives of
Neurology, 41,
825-829.
Lovegrove, W. J.,
Martin, F., & Slaghuis, W. (1986). A theoretical and
experimental case for
visual deficit in specific reading difficulty.
Cognitive
Neuropsychology, 3, 225-267.
Luria, A. (1966). Human
brain and psychological processes. New York: Harper &
Row.
Lyon, G. R., &
Watson, B. (1981). Empirically derived subgroups of learning
disabled readers:
Diagnostic characteristics. Journal of Learning
Disabilities, 14,
256-261.
Mattis, S., French,
J., & Rapin, I. (1975). Dyslexia in children and young
adults: Three
independent neuropsychological syndromes. Developmental
Medicine and Child
Neurology, 17, 150-163.
Mirsky, A.F., Anthony,
B.J., Duncan, C. C., Ahearn, M. B., & Kellam, S. G.
(1991). Analysis of
the elements of attention: A neuropsychological approach.
Neuropsychology
Review, 2, 109-145.
Myklebust, H. R.
(1975). Nonverbal learning disabilities: Assessment and
intervention. In H. R.
Myklebust (Ed.), Progress in learning disabilities
(Vol. 3, pp. 85-121).
New York: Grune & Stratton.
Naglieri, J. A., &
Das, J.P. (1987). Construct and criterion related validity
of Planning,
Simultaneous and Successive cognitive processing tasks. Journal
of Psychoeducational
Assessment, 4, 353-363.
Naglieri, J. A., &
Das, J. P. (1988). Planning-Arousal-Simultaneous-Successive (PASS): A model for
assessment. Journal of School
Psychology, 26, 35-48.
Naglieri, J. A., Das,
J. P., Stevens, J. J., & Ledbetter, M.F. (1991).
Confirmatory factor
analysis of Planning, Attention, Simultaneous, and
Successive cognitive
processing tasks. Journal of School Psychology, 29,
1-17.
Naglieri, J. A., &
Reardon, S. M. (1993). Traditional IQ is irrelevant to
learning
disabilities--Intelligence is not. Journal of Learning Disabilities,
26, 127-133.
Orton, S. T. (1931).
Special disability in spelling. Bulletin of the
Neurological Institute
of New York, 1, 167-200.
Rourke, B. (1978).
Reading, spelling, arithmetic disabilities: A
neuropsychological
perspective. In H. R. Myklebust (Ed.), Progress in
learning disabilities
(Vol. 4, pp. 97-120). New York: Grune & Stratton.
Rourke, B. P., &
Strang, J. D. (1984). Sub-types of reading and arithmetical
disabilities: A
neuropsychological analysis. In M. Rutter (Ed.),
Developmental
neuropsychiatry (pp. 473-488).
New York: Guilford.
Samuels, S. J. (1987).
Information processing abilities and reading. Journal
of Learning
Disabilities, 20, 18-22.
Sattler, J.M. (1988). Assessment
of Children, 3rd Ed. San Diego, CA: J.M Sattler.
Satz, P., &
Morris, R. (1981). Learning disability subtypes: A review. In F.
J. Pirozzolo & M.
C. Wittrock (Eds.), Neuropsychological and cognitive
processes in reading
(pp. 109-141). New York: Academic Press.
Schuerholz, L. J.,
Harris, E. L., Baumgardner, T. L., Reiss, A. L., Freund, L. S., Church, R. P.,
Mohr, J., & Denckla, M. B. (1995). An analysis of two discrepancy-based models and a processing-deficit
approach in identifying learning disabilities. Journal of Learning Disabilities, 28, 18-29.
Searls, E. F. (1985). How
to use WISC-R scores in reading/learning disability
diagnosis. Newark, DE:
International Reading Association.
Semrud-Clikeman, M.,
& Hynd, G.W. (1990). Right hemisphere dysfunction in
nonverbal learning
disabilities: Social, academic, and adaptive functioning
in adults and
children. Psychological Bulletin, 107, 196-209.
Semrud-Clikeman, M.,
Biederman, J., Sprich-Buckminster, S., Lehman, B.,
Faraone, S., &
Norman, D. (1992). Co-morbidity between ADHD and learning
disability: A review
and report in a clinically referred sample. Journal of
the American Academy
of Child and Adolescent Psychiatry, 31, 439-448.
Siegel, L. S. (1988).
Evidence that IQ scores are irrelevant to the
definition and
analysis of reading disability. Canadian Journal of
Psychology, 42,
201-215.
Siegel, L.S. (1992).
An evaluation of the discrepancy definition of dyslexia.
Journal of Learning
Disabilities, 25, 618629.
Snart, F., Das, J.P.,
& Mensink, D. (1988). Reading disabled children with
above-average IQ: A
comparative examination of cognitive processing. The
Journal of Special
Education, 22, 344-357.
Snowling, M. J., van
Wagtendonk, B., & Stafford, C. (1988). Object-naming
deficits in
developmental dyslexia. Journal of Research in Reading, 11(2),
67-85.
Spencer, F., Snart,
F,, & Das, J. P. (1989). A process-based approach to the
remediation of
spelling in students with reading disabilities. The Alberta
Journal of Educational
Research, 35, 269-282.
Spreen, O., &
Haaf, R. G. (1986). Empirically derived learning disability
subtypes: A
replication attempt and longitudinal patterns over 15 years.
Journal of Learning
Disabilities, 19, 170-180.
Stanley, G., Smith, G.
A., & Howell, G. A. (1983). Short-term visual
information processing
in dyslexics. Child Development, 44, 841-844.
Stanovich, K. (1988).
Explaining the difference between the dyslexic and the
garden-variety poor
reader: The phonological-core variable-difference model.
Journal of Learning
Disabilities, 21, 591-604.
Strang, J. D., &
Rourke, B. P. (1985). Arithmetic disability subtypes: The
neuropsychological
significance of specific learning impairments in
childhood. In B. P.
Rourke (Ed.), Essentials of subtype analysis (pp.
167-183). New York:
Guilford.
Tranel, D., Hall, L.
E., Olson, S., & Tranel, N. N. (1987). Evidence for a
right hemisphere
learning disability. Developmental Neuropsychology, 3,
113-127.
Voeller, K. S. (1986).
Right hemisphere deficit syndrome in children.
American Journal of
Psychiatry, 143, 1004-1009.
Watson, C. &
Willows, D. M. (1995). Information-processing patterns in specific reading
disability. Journal of Learning
Disabilities, 28, 216-231.
Watson, C., &
Willows, D. M. (1993). Evidence of a visual-processing-deficit
sub-type among
disabled readers. In D. M. Willows, R. S. Kruk, & E. Corcos
(Eds.), Visual
processes in reading and reading disabilities (pp. 287-309).
Hillsdale, NJ:
Erlbaum.
Wechsler, David (1991). Wechsler
Intelligence Scale for Children - Third Edition: Examiner's Manual. New York, New York: The Psychological Corporation.
Weintraub, S., &
Mesulam, M. M. (1983). Developmental learning disabilities
of the right
hemisphere. Archives of Neurology, 40, 463-468.
Willows, D. M. (1991).
Visual processes in learning disabilities. In B. Y. L.
Wong (Ed.), Learning
about learning disabilities (pp. 163-193). New York:
Academic Press.
Wolf, M., &
Goodglass, H. (1986). Dyslexia, dysnomia, and lexical retrieval:
A longitudinal
investigation. Brain and Language, 28, 154-168.
Wolf, M., &
Obregon, M. (1992). Early naming deficits, developmental
dyslexia, and a
specific deficit hypothesis. Brain and Language, 42, 219-247.
Woodcock, R.W. & Johnson, M.B. (1977). Woodcock-Johnson
Psycho-Educational Battery. Boston: Teaching Resources.
Woodcock, R.W., & Mather, N. (1989). WJ-R Tests of Cognitive Ability: Examiner's Manual. In R. W. Woodcock & M. B. Johnson, Woodcock-Johnson
Psycho-Educational Battery - Revised. Allen, TX: DLM Teaching Resources.
Copyright © 2006-2017 LDinfo Publishing |
Special offer - Use the complete CPI and FBA Profiler FREE for 1 full year!!
|